Artificial Intelligence—particularly large language models (LLMs) and generative systems—has rapidly become a foundational layer of the digital economy. From conversational assistants to image and video generation, AI systems are now embedded in everyday workflows. Yet behind their apparent simplicity lies a vast and growing infrastructure of data centers, high-performance computing clusters, and energy-intensive processes.
This application was developed to make the energy, environmental, and infrastructure implications of AI visible and understandable. By combining multiple data visualizations into a single interactive dashboard, it provides a comprehensive overview of how AI consumes electricity, how it scales, and what it means for global energy systems.
Each visualization explores a different dimension of AI’s footprint—from sector comparisons to water usage, from training costs to geographic distribution—offering both analytical insight and intuitive understanding.
How Large Language Models Work
This infographic explains the lifecycle of an AI model—from training to deployment to answering user prompts.
The diagram clarifies the distinction between:
- Training (high energy, infrequent)
- Inference (lower energy per request, but continuous)
It also emphasizes the central role of data centers in hosting and operating models.
This visualization provides the conceptual foundation needed to understand the other charts, linking technical
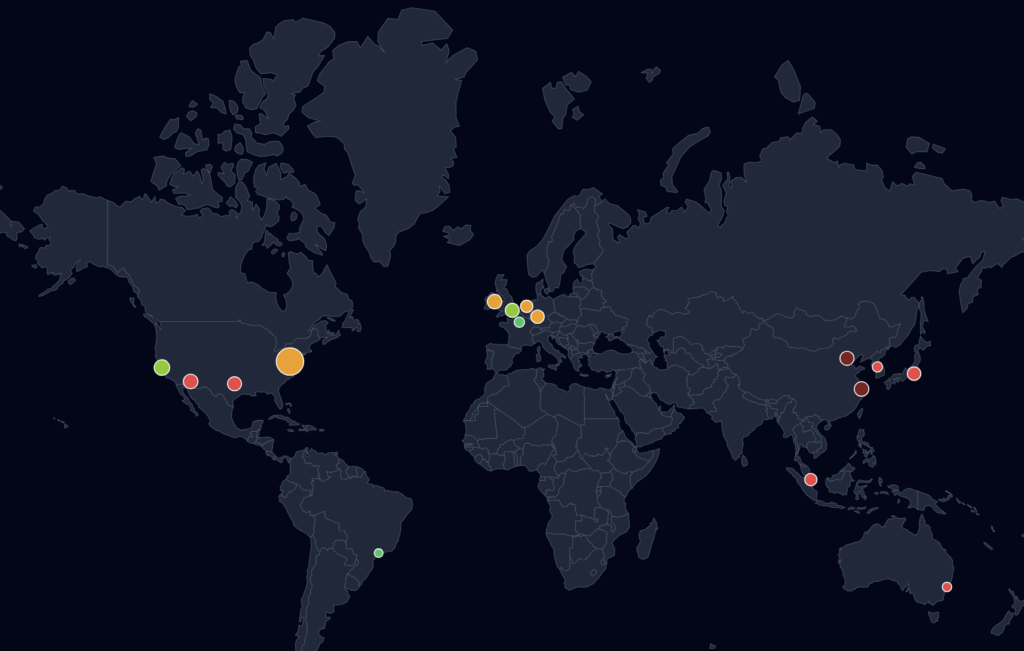
Global Data Center Infrastructure Map
This map shows the geographic distribution of major data center hubs worldwide, including their estimated computing capacity and carbon intensity.
Infrastructure is heavily concentrated in specific hubs such as Northern Virginia, Dublin, and Singapore. These locations are chosen based on connectivity, regulation, and energy availability.
The map highlights a critical tension:
- High-capacity regions often rely on carbon-intensive electricity
- Cleaner regions are not always the primary hosting locations
This creates an opportunity for strategic relocation and optimization of AI infrastructure.
AI vs Other Sectors
This visualization compares the electricity consumption of AI-related workloads with other major sectors such as aviation, industry, or household electricity use.
AI currently represents a relatively small share of global electricity consumption. However, when compared to specific sectors, its growth trajectory becomes striking. The visualization highlights that AI’s consumption is already comparable to niche industrial activities and is growing faster than most traditional sectors.
The key takeaway is not that AI is currently dominant, but that it is scaling at an unprecedented rate. If current trends continue, AI could become a major electricity consumer within the next decade, warranting closer monitoring and policy attention.
AI Energy Growth Over Time
This chart illustrates how electricity consumption linked to data centers—and by extension AI—has evolved over time.
The data shows a steady increase over the past decade, followed by an acceleration in recent years driven by cloud computing and AI adoption. The rise of generative AI is expected to further amplify this trend.
The visualization demonstrates that AI is not a static energy consumer but part of a rapidly expanding demand curve. This reinforces the need for forward-looking infrastructure planning and energy system adaptation.
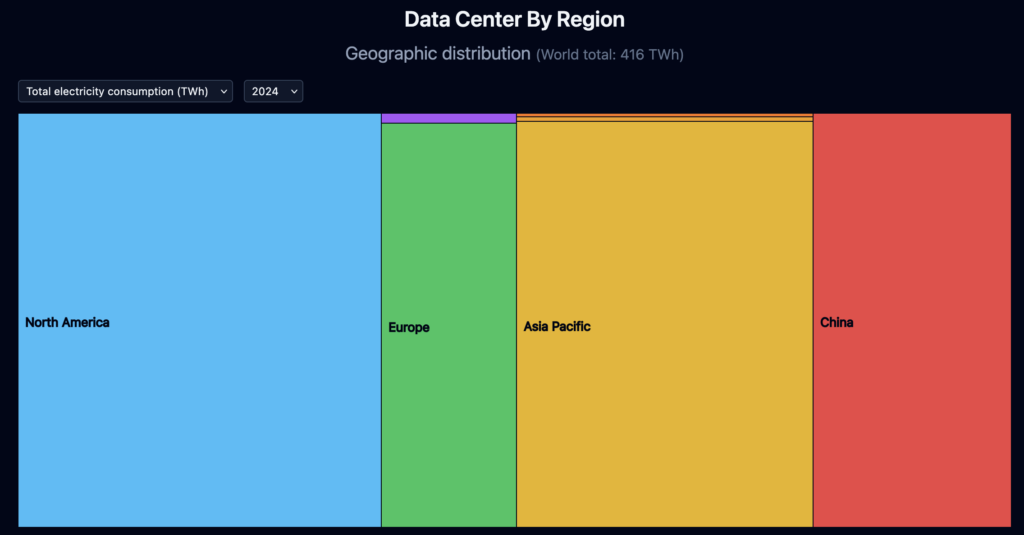
Data Center Energy Consumption by Region
This map and chart break down electricity consumption by geographic region, with a focus on data centers.
Data centers are not evenly distributed. They are concentrated in regions such as the United States, Europe, and East Asia. Each region has different electricity mixes, costs, and infrastructure constraints.
The uneven distribution highlights potential risks:
- Localized grid stress
- Regulatory constraints
- Environmental impact depending on energy mix
It also shows opportunities for optimization, such as locating infrastructure in regions with low-carbon electricity or excess renewable capacity.
Training vs Inference
This visualization compares the energy required to train an AI model versus the energy used during inference (i.e., answering user queries).
Training is extremely energy-intensive but occurs infrequently. Inference, by contrast, is much less energy-intensive per request but occurs continuously and at scale.
The key insight is that inference can dominate total energy consumption over time, especially for widely used applications. This shifts the focus from one-time training costs to ongoing operational efficiency.
Energy per AI Task
This chart estimates the energy required for different AI tasks, such as text generation, image generation, or other workloads.
Different AI tasks have vastly different energy profiles. Text generation is relatively efficient, while image or video generation can be significantly more demanding due to larger models and higher computational complexity.
The visualization shows that not all AI usage is equal. The type of application strongly influences its environmental footprint, which has implications for product design and user behavior.
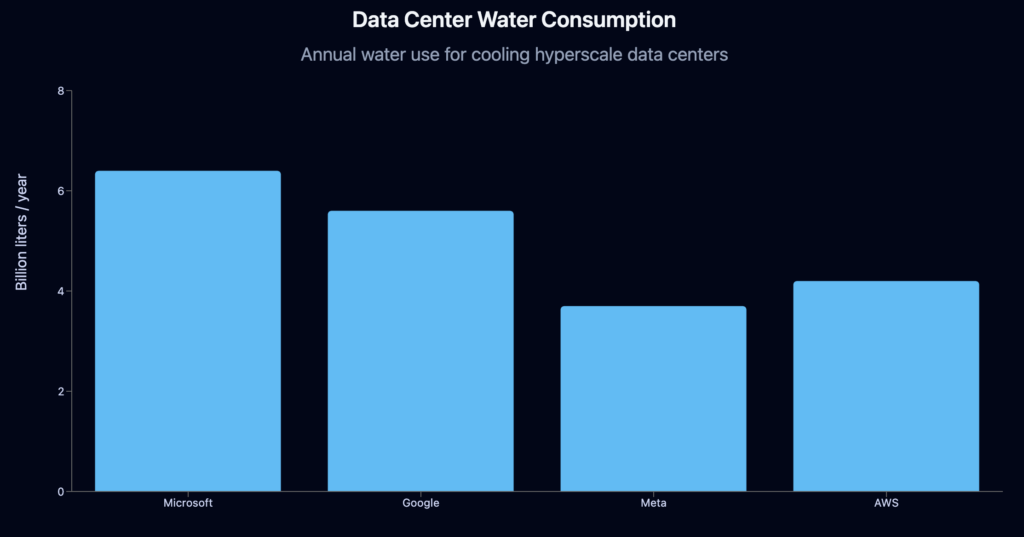
Data Center Water Consumption
This chart focuses on the water required to cool data centers, a less visible but critical resource.
Cooling large-scale computing infrastructure requires significant water resources, particularly in regions using evaporative cooling systems. Water usage can reach billions of liters annually for hyperscale facilities.
The visualization reveals that AI’s environmental impact extends beyond electricity. Water stress and local environmental conditions must also be considered when evaluating the sustainability of AI infrastructure.
Water Consumption per AI Task
This extension of the previous analysis translates water usage into everyday equivalents, such as household or city-level consumption.
By comparing AI water usage to familiar benchmarks, the visualization makes abstract quantities more tangible and relatable.
Users can better grasp the real-world implications of AI usage, reinforcing the idea that digital services have physical resource costs.
Toward a Sustainable AI Future
This dashboard reveals a consistent message: AI is not inherently unsustainable, but its impact depends on how it is designed, deployed, and scaled.
Key Findings
- AI energy consumption is growing rapidly and could become a major share of global electricity demand
- Inference at scale may outweigh training in total energy use
- Geographic location strongly influences emissions
- Data centers require not only electricity but also significant water resources
- Infrastructure concentration creates both efficiency gains and systemic risks
Projections for the Coming Years
Looking ahead, several trends are likely:
- Continued growth in AI demand
Driven by enterprise adoption and consumer applications - Increasing pressure on power grids
Particularly in regions with high data center density - Shift toward low-carbon infrastructure
Including renewable energy sourcing and location optimization - Efficiency improvements in models and hardware
Reducing energy per task but not necessarily total consumption - Greater regulatory and societal scrutiny
Around the environmental impact of AI systems
Final Perspective
AI represents a transformative technological shift, but it also introduces new challenges for energy systems and environmental sustainability. Tools like this dashboard help bridge the gap between technical innovation and real-world impact, enabling better-informed decisions by policymakers, companies, and users alike.
Understanding these dynamics is essential to ensure that the future of AI is not only powerful—but also sustainable.